
News & Updates
Anonymized Testing Outcomes Database (ATOB) Could Increase Precision of Reopening Policies in Hawaii
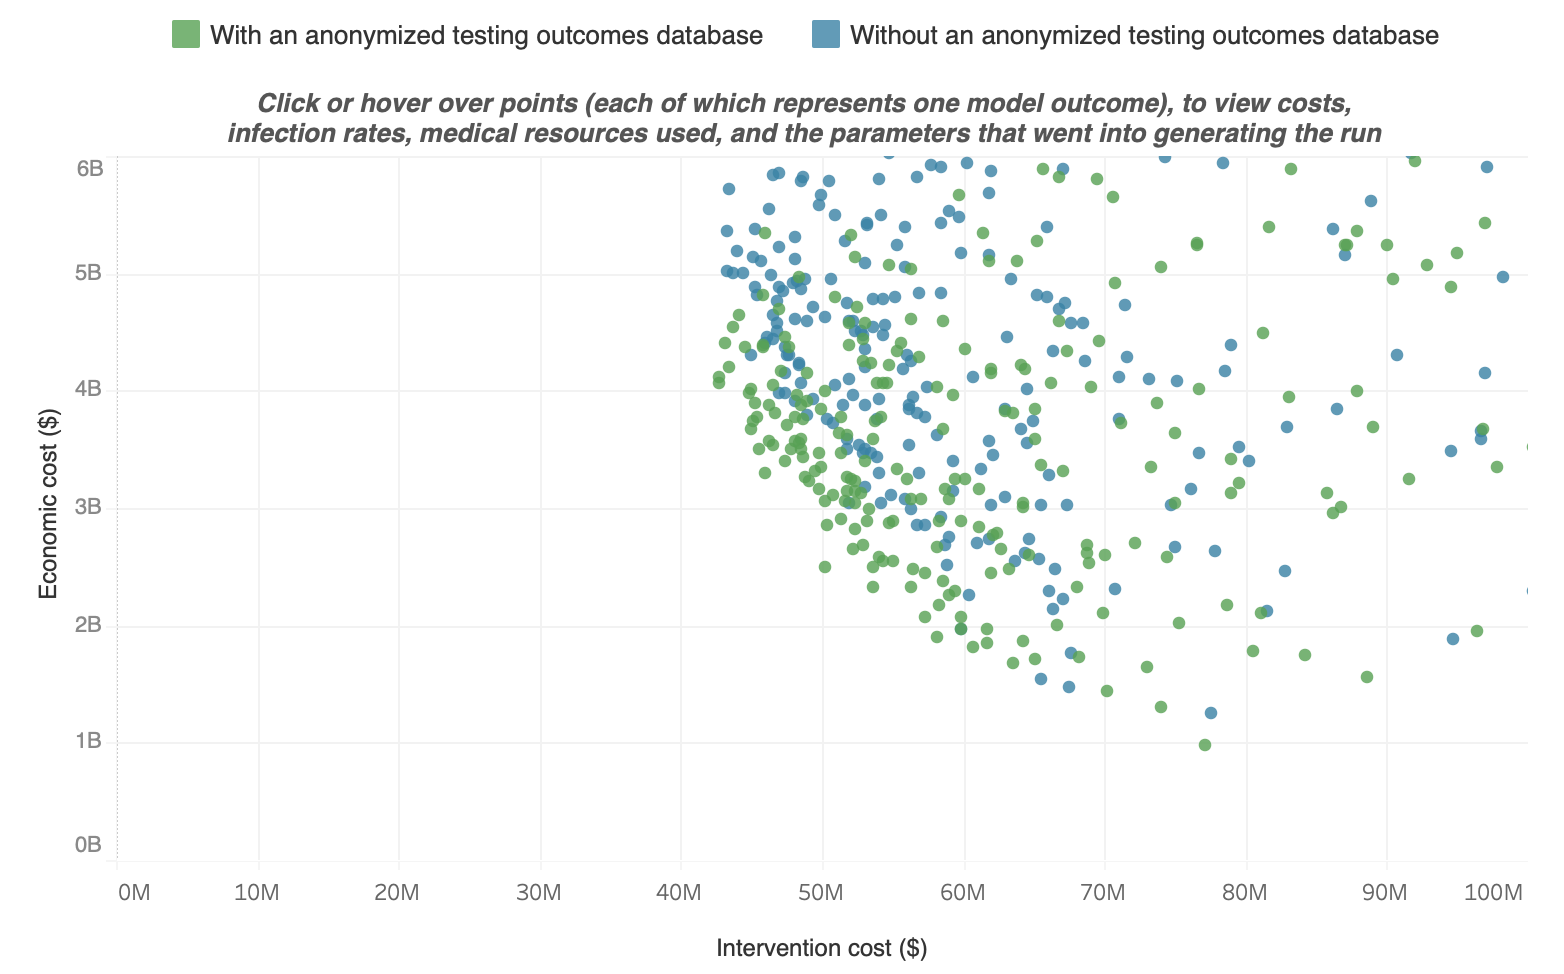
An anonymized testing outcomes database (ATOB) that provides daily aggregated counts of asymptomatic as well as symptomatic cases could save Hawaii an additional $300 million in economic costs over non-ATOB reopening strategies.

Finding the Trade-Off Sweet Spot: Relatively Modest Health System Investments Could Reduce Hawaii’s Economic Losses by Billions
We used our Hawaii Population Model to explore the interplay between the medical resources needed to combat COVID-19 and their associated economic impacts, given current conditions over the next two months. We ran scenarios of every possible combination of health system parameters, with their associated economic costs, iterating and reiterating the model until every combination of infection mitigation strategies had been tested.

How Vulnerable is Hawaii in the Face of a Coronavirus Pandemic?
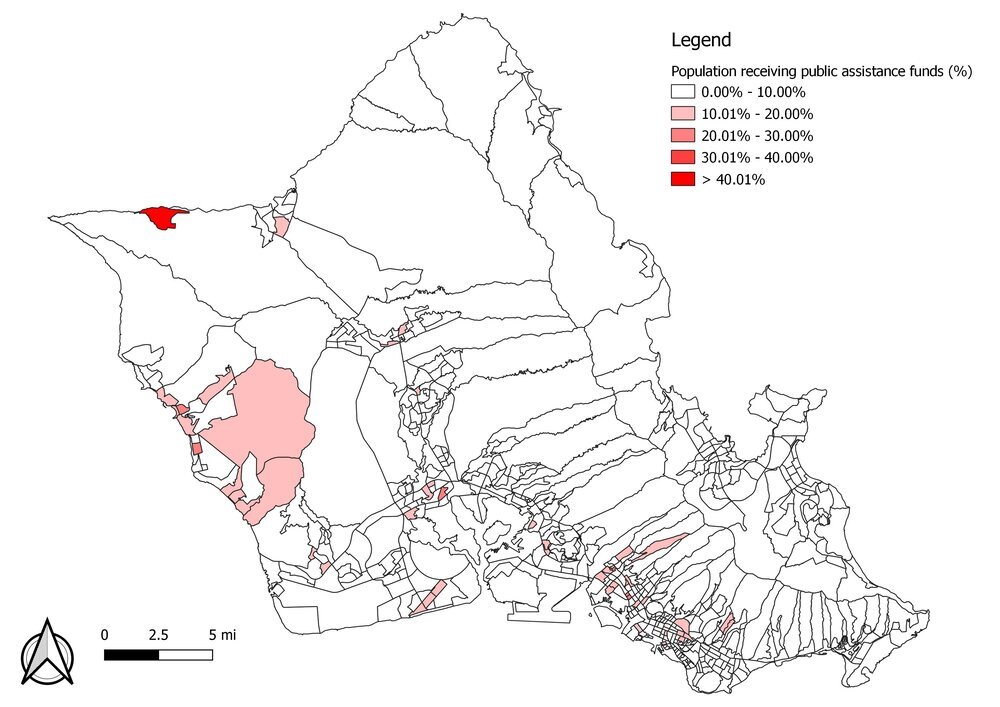
While Hawaii has done well by sheltering in place, other socio-economic factors could place us in a precarious position if we were forced to respond to a full-blown pandemic, disproportionately affecting certain segments of the population–even those who are our closest neighbors. Some have suggested that our decision makers are being overly cautious when considering when and how to reopen the state to business and life in general. They insist that we have turned the corner. And we have. But, as the Surgo Foundation’s index shows, we still have much to be careful about during a pandemic that has yet to show us its teeth and full bite in Hawaii.
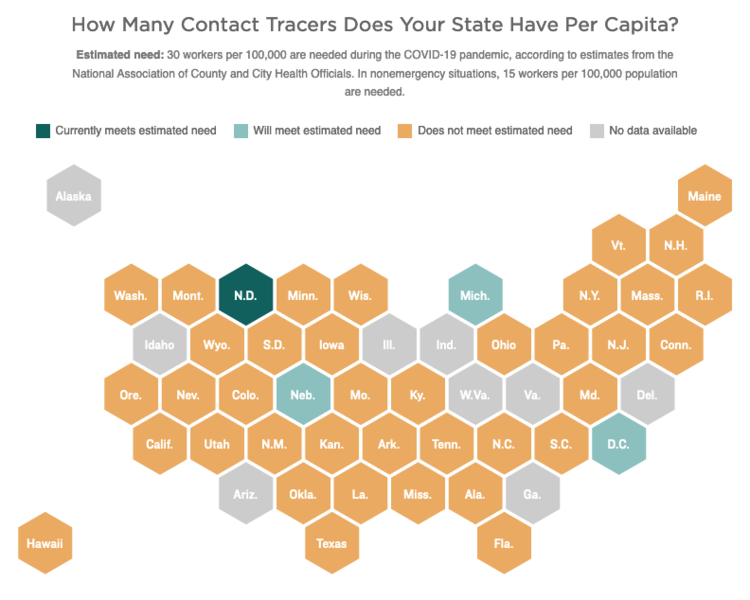
Contact Tracing versus Contact Tracking
Among the many new terms that have crept into our daily language, contact tracing has become one of the most frequently heard in connection with COVID-19. Contact tracing is a traditional public health strategy that has been used to fight the spread of everything from the common flu to the AIDS virus. We often hear public health officials talk about the need to employ contract tracing to not only get the current pandemic under control but to keep the virus from flaring up once we start to reopen cities and states.
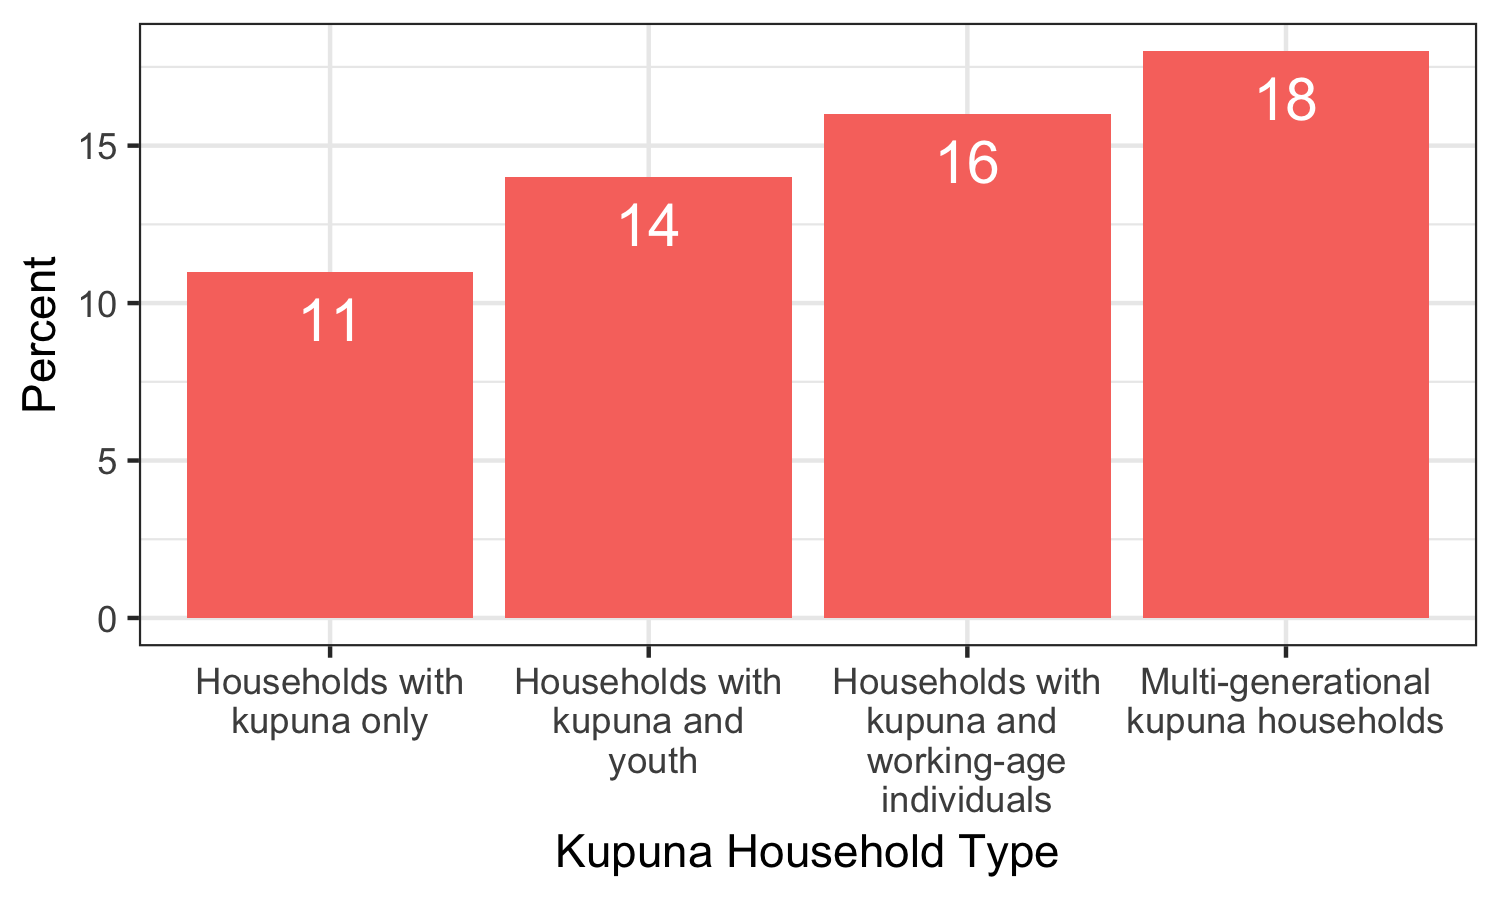
Our Kupuna: Understanding their Risks
Our findings suggest that transmission of COVID-19 is more likely to occur among younger individuals who are more active in the community. In our survey, individuals between the ages of 25 to 44 were the most likely (19%) to report symptoms of COVID-19 or have a household member who tested positive for the virus when compared with other age groups.

Community Vulnerability Index Provides Insights on Pandemic Preparedness
If you’ve done even limited reading about COVID-19 in recent weeks, you’ve likely encountered a short, consistent list of risk factors for individuals developing serious illness from the disease: those ages 65 and older, and anyone with underlying medical conditions. But what do we know about community-level risk for COVID-19? How might we identify which communities are more or less resilient to the current pandemic?
A good place to begin exploring answers to these questions can be found through the COVID-19 Community Vulnerability Index (CCVI).

Ongoing and Comprehensive Information Key to Reopening Hawaii
More importantly, some communities reported higher rates of COVID-19 related symptoms compared to their response rate (e.g. Waianae and Maui)—an indication that these communities may require additional information and resources to mitigate the impacts of the virus. Conversely, communities with lower reported symptoms relative to their response rate may have greater access to information that is helping to protect its citizens (e.g. East Honolulu).

COVID-19 Highlights Vulnerabilities of Rural Hawaii
After an initial delay, cases in rural communities have climbed throughout the country. On March 6, COVID-19 first emerged in Hawaii on its most densely populated island of Oahu. Cases followed in mid-March and early April on the state’s neighbor islands, home to the Hawaii’s more rural areas. As of April 19, 2020, Hawaii Island reported 62 COVID-19 cases; Maui (including Molokai), 106 cases; and Kauai, 21 cases, compared to Oahu’s 385. Although the majority of cases in the state remain on Oahu, the slow and steady growth of confirmed COVID-19 infections on neighbor islands confirms that they are susceptible to the disease as well.
The Good, The Bad, and Social Distancing in Hawaii
During times of crisis, the vulnerable are at even greater risk of becoming casualties of fast moving events. In Hawaii and throughout the nation, we are beginning to see how the current pandemic is overwhelming seniors, those living in poverty, those living on the edge of poverty, and the homeless. They are the most vulnerable in these times. And while they may be overwhelmed, in Hawaii, they are never left behind. That is not what we do nor who we are.
Local Expert-Driven COVID-19 Models for Hawaii Are Long Overdue
We learned the hard way that modeling COVID-19 forecasts is not one-size-fits-all. Recently, we wrote about the advantages of the University of Washington IHME model for understanding peak hospital demand in Hawaii, only to shortly thereafter advise caution in interpreting the model because the projected hospital capacity peak had suddenly shifted by three weeks [link]. A closer inspection of the model revealed problematic assumptions, and underscored a real vulnerability for Hawaii in not having a valid local model.

Insights from the Hawaii COVID Contact Tracking Survey
This is the first in a series posts highlighting results from the Hawaii COVID Contact Tracking Survey conducted by the National Disaster Preparedness Training Center (NDPTC) and the Pacific Urban Resilience Lab (PURL) at University of Hawaii at Manoa. The Hawaii Data Collaborative has partnered with this group to share regular analyses and updates from this survey in the coming weeks.
Early Modeling Suggests Substantial Increases in the Financial Vulnerability of Hawaii's Families
This is the first in a series highlighting results from our new synthetic population modeling project (it’s so new, we do not even have a name for it yet). What excites us most about this modeling approach is its ability to use existing data to simulate the complexity and rapidly shifting nature of life and work in Hawaii. If you have not done so already, we encourage you to familiarize yourself with the approach here.
[Updated] Can Hawaii's Hospitals Meet Peak COVID-19 Demand?
We have been working to evaluate multiple modeling tools for projecting peak hospital demand and capacity sufficiency in Hawaii. The University of Washington (UW) Institute for Health Metrics and Evaluation (IHME) model was identified as best suited for projecting Hawaii hospital capacity in the coming weeks.
Understanding COVID-19 Transmission in Hawaii
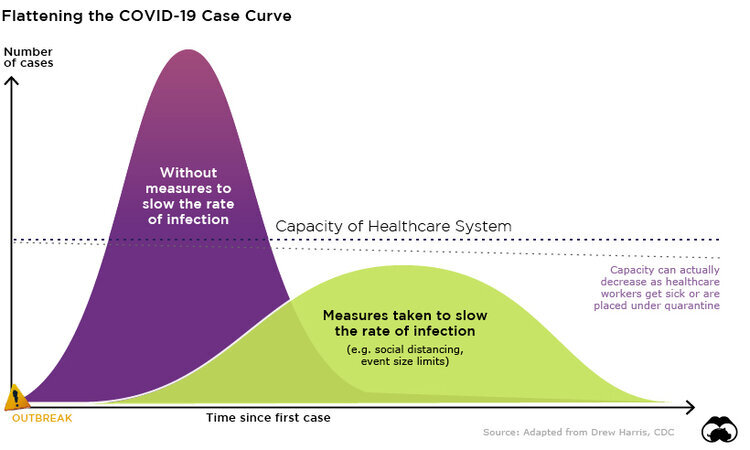
To help illustrate the role of social distancing measures in preventing the spread of COVID-19, we have been working to adapt current transmission models for Hawaii… you can see how existing mitigation efforts are projected to influence the spread of the virus, as compared to no action and more aggressive measures… These forecasts were generated using an accessible modeling tool created by researchers at the University of Basel in Switzerland. This model is updated continuously as new information about COVID-19 becomes available.
The 2020 Census – It’s Hard to Overstate How Important This Is for Hawaii
Census Day is April 1st. What does that mean? It means by that date every household in Hawaii, and across the U.S., will have received an invitation to complete the 2020 decennial Census online, by mail, or by phone. Why should we care about a complete Census count? Here are three primary reasons.
Seeing Red: Simplifying the Search for Meaningful Differences Across Geographic Communities
Waldo Tobler, an American geographer, once said: “Everything is related to everything else, but near things are more related than distant things.” In my last blog post on diversity indices, we found that high diversity index scores across the state made it hard to draw any concrete conclusions about variations in racial, ethnic, and birthplace diversity across Hawaii’s census tracts. Tobler’s words of wisdom, his “First Law of Geography,” instead directs us to compare data at a more local scale.

Hawaii Financial Health Pulse Report Provides In-Depth View of Residents' Financial Struggles
A study released yesterday further substantiates the financial hardships faced by, and resilience exhibited by, people living in Hawaii. The Hawaii Financial Health Pulse, sponsored by Hawaii Community Foundation and Bank of Hawaii, is a localized version of the U.S. Financial Health Pulse, which examines the financial health of Americans. In close collaboration with local advisors, The Financial Health Network surveyed more than 1,600 Hawaii residents to better understand their “financial health”—that is, how they spend, save, borrow, and plan in their financial lives.

Newly Released CDC Estimates Reveal Community-Level Health Indicators
Recently the 500 Cities project, a collaboration between the U.S. Centers for Disease Control and Prevention (CDC) and the Robert Wood Johnson Foundation, released small-area estimates of health outcomes, risk factors, and healthcare usage for the 500 largest cities in the U.S. While health measures are often reported at the state level, the 500 Cities project seeks to equip local health stakeholders with more granular estimates of community health data, thereby informing important policy, planning, and programmatic decision-making.

Bite-Size Data Viz: State of Hawaii Operating Budget
The State of Hawaii’s Operating Budget is important for many reasons: it reveals the state’s revenue sources and expenses, dictates the investments our policymakers choose, and provides an overall picture our collective priorities. Recent budget data for fiscal years 2014-2019 is available on Hawaii’s Open Data portal as an Excel spreadsheet that includes more than 500,000 rows of individual line items.

Bite-Size Data Viz: Hawaii Department of Education School Status & Improvement Report
The School Status & Improvement Report (SSIR) is one of several major reports produced by the Hawaii Department of Education (HIDOE) as part of their effort to provide regular, easy-to-understand accounts of school performance and progress across the state.