
Finding the Trade-Off Sweet Spot: Relatively Modest Health System Investments Could Reduce Hawaii’s Economic Losses by Billions
Analysis Highlights:
Our modeling suggests modest investments in health system interventions for managing COVID-19, focusing mostly on contact tracking and expanded testing, could save Hawaii’s economy between $3 and $4 billion in lost activity.
The cost for maximizing the economic benefit of these interventions lies in the $50M - $75M range. Health system investments above $75M demonstrate limited to no additional health or economic benefit.
Few would disagree that first and foremost, COVID-19 represents a public health issue. Mounting an appropriate health system response—and tapping the resources needed for that response—saves lives and decreases both the extent and speed of the disease’s spread. But as the number of new infections slows in Hawaii, navigating the trade-offs between interventions needed to combat COVID-19 and the economic losses resulting from those interventions becomes not only prudent, but necessary.
Model Compares Complex Scenarios for Post-COVID Economic Recovery
What health system tools and interventions do we need to be able to safely reopen the economy? How might we minimize morbidity and mortality due to the disease while also reducing economic losses? Which combination of intervention strategies will maximize public health while keeping economic costs low?
To address these questions, we used our Hawaii Population Model to explore the interplay between the medical resources needed to combat COVID-19 and their associated economic impacts, given current conditions over the next two months. We ran scenarios of every possible combination of health system parameters, with their associated economic costs, iterating and reiterating the model until every combination of infection mitigation strategies had been tested.
The resulting 2,070 outcomes were used to generate scatter plots that make it easy to see all at once the relationships between projected health system costs, their associated economic costs, and resulting health outcomes.
Interventions in $50M -$70M range offer biggest “bang for the buck” in economic savings
Among all model runs, those that maintained current levels of social distancing, testing, and personal protective equipment (PPEs) provision, while investing more in timely contact tracing and an anonymized testing outcomes database (ATOB; a system for estimating asymptomatic as well as symptomatic cases)* were most effective and feasible in terms of public health impact, with moderate economic costs and relatively low intervention costs.

The steep negative slope (the red line going down and to the right) in this cluster of outcomes suggests that modest additional spending on medical interventions, particularly testing and tracing, yield significant savings in economic costs over the next two months. Comparing outcomes along this curve in the scatterplot, we see that increasing investments in health systems capacity from about $42M to $62M to expand the pool of contact tracing staff and broaden testing capacities, leads to corresponding decreases in economic costs from roughly $5.8B to $1.8B—a savings of $4B, and a 200-fold return on increased health system investment.
COVID-19 case projections suggest limited marginal benefit above $75M in intervention costs
Now let’s look at the entire range of projected outcomes generated by the model for the two-month period. The scatterplot below shows all 2,070 modeled outcomes. These points are colored with lighter shades of blue representing fewer projected infections and darker blues representing more infections:
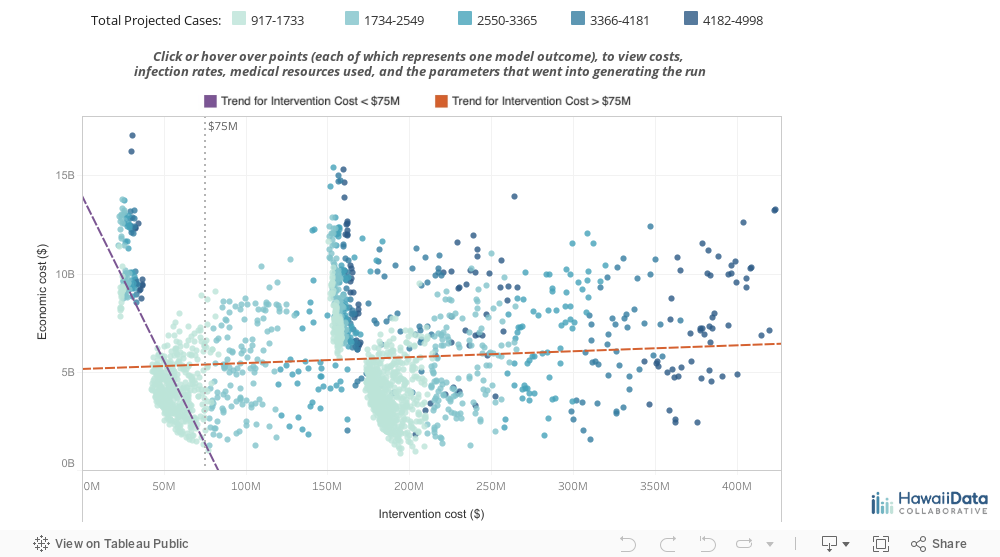
Two insights are immediately apparent:
Intervention costs in the $50M - $75M range are projected to result in relatively fewer COVID-19 cases – on average 1,602 – as compared to investments in the $175M - $200M range – 2,095 on average. This means we would expect no additional public health benefit from much heavier spending on testing, contact tracing, and PPEs that exceeds $75M in the next two months.
There are also few additional economic benefits associated with investments in health systems capacity above $75M. Increases in health system spending below $75M tracks with a sharp decrease in projected economic losses (purple line) over the two month time period. In comparison, health system spending above $75M (orange line) merely tracks higher infection rates in runs farther from baseline settings. In these outcomes, more simulated infections are generally accompanied by higher economic losses.
In other words, our model suggests that spending more than $75M on health systems interventions brings no substantive benefit in public health outcomes or economic relief.
Given the breadth of the COVID-19 challenge in Hawaii and the need to make timely decisions for navigating the crisis effectively, we believe models and analyses like this are absolutely essential. However, we would have preferred to have more data, and time to evaluate all of the assumptions required to craft this model – but the urgencies of the moment do not allow us this luxury. We encourage you to consider our analysis, and then use the visualizations to learn and observe how these factors interrelate in the model to draw your own conclusions. And of course, please reach out info@hawaiidata.org if you would like to discuss this further with our team.
Methodology & Limitations
Infection spread models were run across multiple agent-based simulations drawing from a database of synthesized households for Hawaii. Intervention costs are calculated as tests, PPEs, masks, ICU and ventilator days necessary to address the extent of infection within each microsimulation run.
Economic costs are calculated as losses in employment and wages, as well as losses in economic productivity and business revenue due to policies such as social distancing, restaurant closures, and telework. Recent unemployment data is being added to the microsimulation to account for real-time job and wage losses across sectors.
Intervention parameters for quarantines, self-isolation, and essential worker protection measures should be interpreted as the extent and efficacy of each intervention (e.g., a quarantine parameter of 1.0 roughly translates to full quarantine for all households within a PUMA or Census Tract). Estimates of our current conditions in the lower-left hand corner (modest intervention cost and medium-high economic costs) are preliminary and can be refined with better data on wage and job losses, as well as better quantification of social distancing policies.
Our analysis for this post relies primarily on scatter plot data. Scatter plots work best when visualizing a large number of relationship data points irrespective of time; in our case, the scatter plot illustrated over two thousand possible scenarios. If you’re curious to explore the full range of scenarios that we simulated, you can use the tool below, or download the data here.

Intervention cost, on the horizontal axis, represents the health care resources needed to combat COVID-19 in Hawaii, including masks, tests, and hospital resources. Economic cost, on the vertical axis, represents lost economic revenue and productivity for the State due to COVID-19 and interventions in response. The most desirable combinations cluster in the lower left-hand corner, offering low economic costs at relatively low intervention costs.