
News & Updates

Bite-Size Data Viz: State of Hawaii Operating Budget
The State of Hawaii’s Operating Budget is important for many reasons: it reveals the state’s revenue sources and expenses, dictates the investments our policymakers choose, and provides an overall picture our collective priorities. Recent budget data for fiscal years 2014-2019 is available on Hawaii’s Open Data portal as an Excel spreadsheet that includes more than 500,000 rows of individual line items.

Bite-Size Data Viz: Hawaii Department of Education School Status & Improvement Report
The School Status & Improvement Report (SSIR) is one of several major reports produced by the Hawaii Department of Education (HIDOE) as part of their effort to provide regular, easy-to-understand accounts of school performance and progress across the state.

With Help from PolicyMap, Bikeshare Hawaii Tailors Biki Access for Low-Income Residents
You’ve probably seen them: teal blue bicycles that locals and visitors alike have come to count on for quick, easy, and affordable transportation. Launched in 2017 and operated by Bikeshare Hawaii, Biki bikes have become a familiar sight throughout downtown Honolulu, numbering 1,300 bikes at 130 self-serve locations.

Three Questions to Ask Before You Start Collecting Data
Whether it’s talk of “big data” in the business world, predictive data analytics in the public sector, or data-informed program strategy among nonprofits, data collection and analysis are increasingly seen as requirements for savvy organizations. As our reliance on technology continues to grow, you might be feeling a sense of urgency about jumping on the data train. Identifying the right tools for data collection suddenly feels critical to your company’s success. But where to begin?
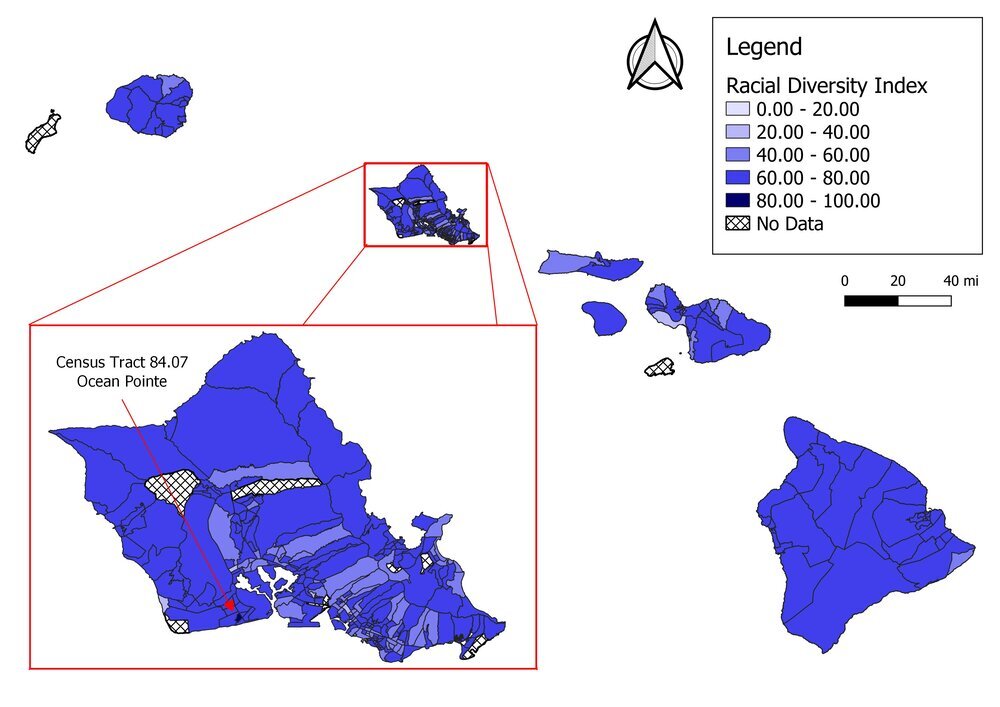
Measuring Diversity In a Diverse State: How Useful are Diversity Indices in Hawaii?
We may recognize our diversity anecdotally – that we live, work, and play with people from a wide variety of backgrounds – but is it possible to capture how diverse a place is through data and numerical evidence? Diversity indices attempt to do just that, and have gained popularity in recent years. A diversity index is a score, derived from population data, that measures the number and abundance of different groups.

The Danger of Letting Data Define the “Thing”
There is growing interest from a broad range of local stakeholders in better understanding our local challenges through data. This cadre of stakeholders believes that making community indicators more accessible will be incredibly useful for building a better understanding of well-being – and that understanding can shape the actions we take to improve our communities. If decision makers can get a high-level sense of conditions and outcomes related to health, education, economic opportunity, housing, etc., they can make more informed decisions regarding how to allocate resources to improve disparities.