
Measuring Diversity In a Diverse State: How Useful are Diversity Indices in Hawaii?
by Kendrick Leong, Ulupono Initiative
Hawaii is often considered one of the most diverse places on the planet. We pride ourselves on being a “melting pot,” where no single race or ethnicity has a clear majority and the traditions, practices, and foods of the groups that call Hawaii home have been synthesized into a unique local culture. We may recognize our diversity anecdotally – that we live, work, and play with people from a wide variety of backgrounds – but is it possible to capture how diverse a place is through data and numerical evidence?
Diversity indices attempt to do just that, and have gained popularity in recent years. A diversity index is a score, derived from population data, that measures the number and abundance of different groups. Although diversity indices were first used to measure the species richness of plants and animals in a given location, they have been adapted to measure characteristics of human populations as well.
Several diversity indices are derived from the probability that two people selected in a given area would be of different races or ethnicities. Simply speaking, if you were walking down the street, what are the odds that the first person you meet will be of a different race or ethnicity? The higher the probability, the higher the score. A score of 25, for example, would reflect a 25 percent chance that you and the person you meet would be of different races or ethnicities. Let’s take a look at the racial diversity scores for census tracts across Hawaii:

Census Tract 84.07, Ocean Pointe on Oahu, tops the list with a racial diversity score of 82.26. It’s also important to note that over 92 percent of inhabited census tracts in Hawaii have a racial diversity score above 50. Odds are pretty good that two people in Hawaii selected at random will be of different racial backgrounds.
Another diversity index also takes into account how diverse a population is in terms of where they were born. Using the same principles as the racial diversity index, a birthplace diversity index measures the probability that two people selected at random will have been born in different birthplace categories – in-state, out-of-state, or abroad. Let’s look at the birthplace diversity scores for census tracts across Hawaii:
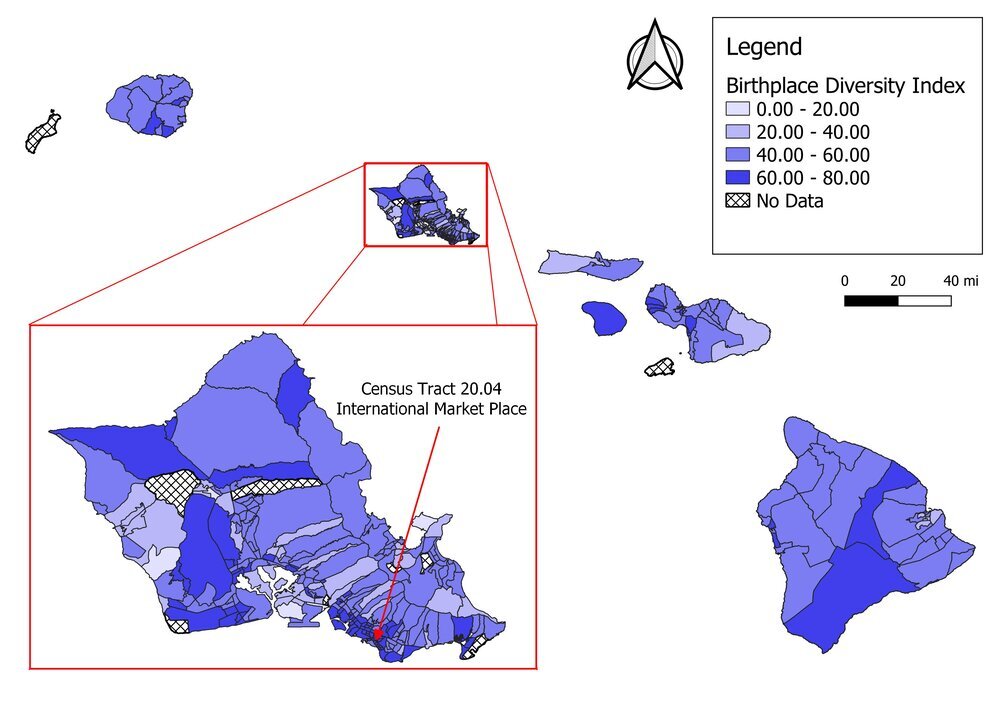
This time, Census Tract 20.04, International Market Place in Waikiki, exhibits the highest birthplace diversity with a score of 72.28.
Averaging the racial and birthplace diversity indices, we can see that, as far as the numbers go, Hawaii can indeed be considered “diverse.” Nearly 88 percent of census tracts have a diversity score higher than 50. Hawaii as a state has the highest racial diversity score in the nation according to 2015 data, and this achievement continues down to the census tract level.

Diversity indices aim to capture a population’s diversity in numerical terms, providing researchers with the demographic evidence that Hawaii is indeed as diverse as one may claim anecdotally. However, Hawaii’s high diversity scores make it difficult to study differences in diversity within communities. That is, however different two areas’ diversity scores may be, they are still both high when compared to the nation as a whole.
This fact reveals the limitations of trying to distill the lived experience of racial, ethnic, and birthplace diversity into a number. A diversity score is a useful metric when ranking populations that vary greatly in diversity. It is also useful for documenting the “most diverse” place and the “least diverse” place. It is less useful for discerning the difference between, for example, two census tracts with diversity scores of 73.0 and 70.0. What do those three points mean?
The study of diversity in Hawaii is further complicated by the relative insignificance of high diversity score comparisons. Diversity indices may actually be undercounting Hawaii’s diversity score when accounting for populations of two or more races. This is because census respondents who identify as bi- or multi-racial are treated as one race category when calculating the probability that two people selected at random will be of different races. Although two mixed-race individuals may have completely different ethnic backgrounds, their meeting is not considered a “diverse” one. And in a state where mixed-race individuals make up nearly a quarter of the population, the aggregation of mixed-race individuals into a singular “two or more races” racial category under-represents the actual diversity in a given place.
Disaggregating the “two or more races” racial category can help calculate a more accurate diversity score. But with an almost-infinite number of combined-race permutations, calculating each different mix of races as its own racial category isn’t feasible. Therefore, on one end of the spectrum is the conservative estimate used by most diversity indices that utilizes Census Bureau-defined racial categories; by this measure Hawaii tops the list in terms of racial diversity score. On the other end of the spectrum is a diversity index that disaggregates the “two or more races” category (and maybe even the Asian category), further inflating Hawaii’s already high racial diversity score.
Perhaps the study of diversity in Hawaii will soon outgrow the metrics and ranking numbers that are valuable elsewhere. In the context of our “melting pot” community where seemingly every meeting could be considered a “diverse” one, a number, index, or score cannot fully encapsulate how diversity has functioned as a social good, advancing our collective well-being. A diversity index does not capture how diversity may contribute, for example, to higher quality education, more tolerant individuals, or more respectful discourse.
Measuring diversity in a diverse state, then, may ironically have nothing to do with racial diversity. Rather than being understood as a measurement of probability, differences in diversity might instead be better reflected by a model that captures the lived experience of diversity and how that experience differs between communities. Unfortunately, such a model doesn't exist... yet. But reimagining the "measurement" of differences in the expression of culture and traditions--and the benefits associated with them--might ultimately offer a more meaningful understanding of diversity that can't be reduced to a number.
Kendrick Leong is a second year Master's student in Urban and Regional Planning at the University of Hawaii at Manoa, and an intern at Ulupono Initiative.