
Newly Released CDC Estimates Reveal Community-Level Health Indicators
by Tiana Tran and Nick Redding, Hawaii Data Collaborative
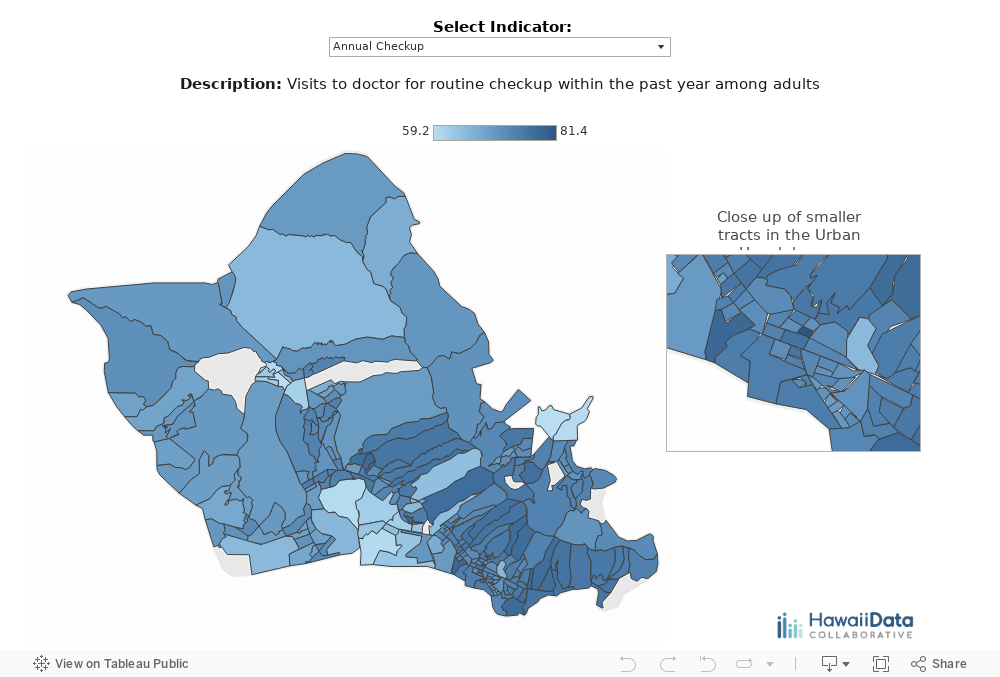
Recently the 500 Cities project, a collaboration between the U.S. Centers for Disease Control and Prevention (CDC) and the Robert Wood Johnson Foundation, released small-area estimates of health outcomes, risk factors, and healthcare usage for the 500 largest cities in the U.S. While health measures are often reported at the state level, the 500 Cities project seeks to equip local health stakeholders with more granular estimates of community health data, thereby informing important policy, planning, and programmatic decision-making.
The full dataset from the 500 Cities project can be downloaded here.
The data behind this model comes from the Behavioral Risk Factor Surveillance System (BRFSS), a survey measuring health-related behaviors and outcomes of residents across the U.S. These surveys are conducted annually by state departments of health in cooperation with the CDC. While the data can be tabulated and aggregated by researchers, policymakers, and nonprofit leaders in numerous ways, geographic breakdowns are among the most valuable for understanding health in local communities.
Benefits of Community-level Indicators
Community-level indicators help us understand how a given community is performing on specific health indicators (e.g. prevalence of asthma, major depression, substance use disorder, etc.), and how that community is performing on those indicators relative to other communities. The latter information in particular can reveal communities that are faring well and, more importantly, communities that may be experiencing significant health challenges.
The Hawaii State Department of Health (DOH), through the Hawaii Health Data Warehouse, makes annual BRFSS data available on their Indicators Based Information System (IBIS) platform (an excellent data resource). Visitors to the IBIS platform can see many health-related indicators at the subcounty level, either based on the DOH “Community” region scheme or by Department of Education “School Complex.” Both are helpful, and represent the best possible level of regional granularity from local BRFSS data given the sample size.
Modeled Data May Help Address Limitations of Aggregated Data
When reporting straight aggregations from survey data, the sample size of even large surveys like the BRFSS limits the reliability of small area estimates. Within a region, data from communities exhibiting poor health outcomes might be masked by being aggregated with data from communities with better health outcomes. A case in point: Although the island of Oahu comprises a multitude of urban, suburban, and rural communities, there are only 13 DOH regions for which BRFSS data are reported. One of the 13 DOH regions includes the communities of Kailua and Waimanalo. The BRFSS data for 2017 found that 9.2 percent of residents in that region have diabetes. However, when we look at the modeled data for that region from the 500 Cities project, we see that the estimated prevalence of diabetes ranges from 8.7 percent in Lanikai to 13.8 percent in Waimanalo Beach—in other words, diabetes prevalence is 1.6 times greater in Waimanalo Beach than in Lanikai. Differences like this matter a great deal for identifying intervention priorities.
“Modeled data” represents an exciting opportunity to unlock more granular community insights from our data. At the Hawaii Data Collaborative, we will be working to unlock more insights using the modeled data approach, so stay tuned! In the meantime, we encourage you to spend some time with the health visualization above, as well as our other visualization tools.