Bite-Size Data Viz: State of Hawaii Operating Budget
Note: Posts in our Bite-Size Data Viz category provide succinct, specific examples of publicly available data from Hawaii sources, reimagined through a data visualization lens. Have suggestions for other data you’d like to see visualized? Send your comments or suggestions to info@hawaiidata.org.
Data Source
The State of Hawaii’s Operating Budget is important for many reasons: it reveals the state’s revenue sources and expenses, dictates the investments our policymakers choose, and provides an overall picture our collective priorities. Recent budget data for fiscal years 2014-2019 is available on Hawaii’s Open Data portal as an Excel spreadsheet that includes more than 500,000 rows of individual line items. This format makes it difficult to get a sense of the flow of dollars in and out of even one single state government department. Even if you aggregated the data on your own, you would only gain a small snippet of insight into the overall budget.
Data Viz
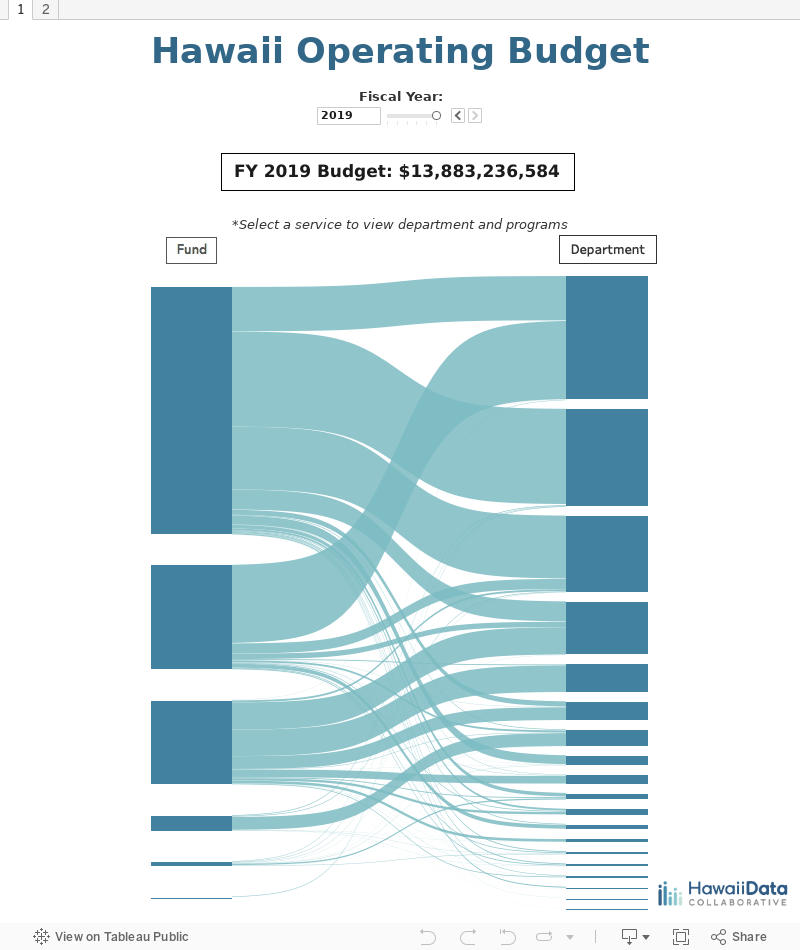
To provide a big picture view of the entire operating budget, Hawaii Data Collaborative turned the budget spreadsheet into a State of Hawaii Operating Budget visualization. This diagram depicts the flow of dollars from fund type to service, with the width of each band proportional to the magnitude of funding “flowing” through that path. Within each service, the departments and programs those funds are going towards are further broken down and described.