
The Power and Potential of Disaggregated Data
by Joyce Lee-Ibarra, JLI Consulting LLC
This post is part of a series regarding data equity. In a recent post, we explored the concept of data equity. In this post, we build on this concept by exploring data disaggregation—what it is, why it’s important, and how it’s relevant to decision- and policy making in Hawaii.
Among the most accessible and powerful strategies for advancing the equitable use of data is through disaggregation. But why is disaggregated data important, and what does it make possible?
What is Data Disaggregation, and Why Does It Matter?
When data is collected, it is sometimes pooled together—or aggregated—for the purposes of analysis, with summary findings for the overall group resulting. While in certain contexts aggregating data is sensible and necessary, aggregation often assumes a level of homogeneity, or evenly distributed similarity, within the collected data. This assumption can be problematic if, in fact, subgroups within the data are substantively different, because aggregation can mask underlying differences between those groups. By disaggregating data, or breaking out data by key characteristics, those differences are easier to see and compare.
Many of us are accustomed to seeing data on various demographic factors such as sex/gender and race/ethnicity. But as our understanding of these categories and their implications evolves, so, too, must our approach to collecting and analyzing data. For example, a growing awareness regarding gender identity has led health researchers to identify health differences among transgender and gender non-binary people, suggesting the importance of classifying and examining this group as a unique subpopulation. Similarly, although data is often analyzed by broad racial/ethnic categories such as (in the case of the US Census Bureau) American Indian/Alaska Native, Asian, Black/African American, Native Hawaiian or Other Pacific Islander, and White, researchers and policymakers are increasingly aware that even these categories may conceal important disparities between more granular subgroups.
Growing our understanding of these differences is not an idle academic exercise. By detailing what subgroup differences exist, legislators and community leaders become better equipped to make informed, targeted policy-making and resource allocation decisions. These decisions in turn can help create more equitable outcomes for all community members across dimensions such as education, employment, criminal justice, and health.
How Is Data Disaggregation Relevant in Hawaii?
One of the most relevant applications of data disaggregation in Hawaii is regarding race/ethnicity. Asians, Native Hawaiians, and Pacific Islanders are at times grouped together under the labels “Asian American and Pacific Islander (AAPI)” or “Asian and Pacific Islander (API)”—e.g., for government classification, or for the purposes of coalition building and advocacy. These umbrella terms can be useful for analysis—for instance, when survey data doesn’t yield enough subgroup respondents to generate unique analytic categories. However, with the highest percentage of Asians in the country, as well as the largest Native Hawaiian/Pacific Islander population in the U.S., Hawaii is better positioned than many states to dig into possible disparities among AAPI subgroups. What is more, Hawaii has a vested interest not only in understanding more specifically whom these labels represent, but also whether and what diversity exists within each category.
Aggregated data for Asian Americans and Pacific Islanders often reinforces the “model minority” stereotype, in which AAPIs appear to achieve success and better-than-average outcomes in many realms. But on closer inspection, we can see a high degree of variability within the AAPI group across socioeconomic indicators, as analysis by the nonprofit Washington Center for Equitable Growth below demonstrates. For example, while AAPIs collectively boast the highest median household income of all racial/ethnic groups, disaggregated data for AAPIs shows a high degree of variability, with numerous subgroups’ median household income falling below that for the U.S.:


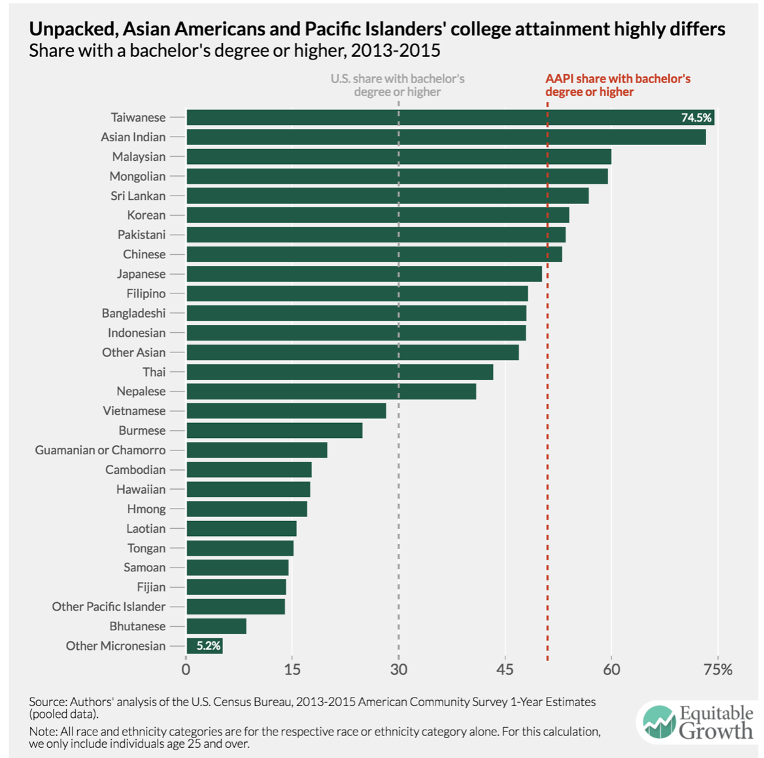
Similarly, AAPIs as a whole have the highest percentage of college graduates compared to other groups. However, disaggregation reveals that some Asian and Pacific Islander subgroups experience college attainment percentages far below the U.S. average:

Wide health disparities exist within the AAPI population as well. Asian Americans as a whole typically rank healthier than the U.S. population as a whole. However, a recent study that employed data disaggregation for five Asian American subgroups uncovered previously hidden health disparities for each group, with Filipinos exhibiting the worst health of all Asian subgroups in the study. Research shows that Native Hawaiians and Pacific Islanders, when examined distinctly from Asian Americans, exhibit higher rates of health risks compared to non-Hispanic Whites.
Disaggregated data has added a nuanced understanding to Hawaii’s experience with the current coronavirus pandemic. Although Hawaii has consistently been among the states with the lowest per capita rates of COVID-19 cases, closer analysis has shown that certain subgroups—namely, non-Native Hawaiian Pacific Islanders and Filipinos—have experienced disproportionate numbers of cases from the disease, as data from the state Department of Health’s Disease Outbreak Control Division indicates:

Consistent Collection of Specific Race/Ethnicity Data Is Critical to Advancing Equity in Hawaii
The examples above show that consistent collection, reporting, and analysis of more granular categories of race/ethnicity are critical, particularly given the diversity of Hawaii’s population. Such data helps identify areas of need among racial/ethnic subgroups that might go unnoticed when analyzed in aggregate, and can help shape programs and policies to advance more equitable outcomes for all communities in the state. Unfortunately, however, many state agencies don’t consistently track this information in publicly available datasets. Capturing this key demographic data will better enable our state to pinpoint populations with specific needs, and ultimately inform resource allocation and policy decisions to advance Hawaii’s collective well-being.
Joyce Lee-Ibarra is principal of JLI Consulting LLC and a consultant to the Hawaii Data Collaborative.