
Census 2020? Check one: ☐Yes ☐No
Census Response Rates, Accuracy, and Implications of an Inaccurate Count
by Justin Hong
Summary
Every ten years during the Census, a large percentage of the United States’ population does not respond to the Census. Despite this, the Census Bureau must count all individuals, whether or not they respond. The Census Bureau employs different methods to obtain a “complete” count, but studies have shown that lower self-response rates are correlated with less accurate results. The accuracy of the Census is not the same for all groups—some groups are more likely to be undercounted than others. Early identification of these individuals is important to focus efforts during the Census, but Census 2020 has been especially challenging given recent events. The response rates in Hawaii for the 2020 Census were worse than one might expect in a “normal” census year. In light of this and other recent events, this census will have missed some of the more marginalized in our communities. We have seen, and can confirm, the undercounting of the population in our extended ʻohana living in the continental United States—of whom, approximately 24,000 Native Hawaiian youth ages 0 to 18 were not counted in 2000. When a group of individuals is not represented in the Census, they are not represented in our system of government. The communities in which they live do not receive needed funding for important social support programs. The very existence of these individuals may not even be known. All of this results in the marginalization of individuals who are already living on the margins.
An Overview of Census Taking
The first census was conducted in 1790. The process consisted of enumerators traveling from house to house and asking household members basic demographic questions. It wasn’t until 1960 that the first mail-out census was conducted. However, mail-out forms were only sent to households in urban areas and enumerators were required to physically pick-up completed census forms. For the 1970 Census, the Census Bureau used a mail-out/mail-back format for large metropolitan areas. The mail-out format was the primary method for collecting responses until 2020, when online (internet) responses made up the majority of self-responses—responses where households respond of their own accord.
Regardless of the format used, a large percentage of the United States’ population does not respond to the Census. In 2010, about one-quarter of households did not respond and in 2000, about one-third of households did not respond. Further, the percentage of Hawaii’s households not responding to the census was greater than that of the national average in both 2000 and 2010.
The Census Bureau is required to enumerate all individuals in the nation. Every person, even those who did not respond to the census, must be counted. To do this, the Census conducts a nonresponse follow-up (NRFU). During the NRFU, a census taker visits households that did not respond to the census. If a census taker is unable to contact a member of the household, additional measures are taken to appropriately count the household and its members. For the 2020 Census, methods in addition to household visits were employed during the NRFU phase due to the COVID-19 pandemic, including: phone, email, and additional paper questionnaire follow-ups.
As of the writing of this article, 66.8 percent of households self-responded and 33.1 percent of households were counted during the NRFU phase in the United States. Taken together, 99.9 percent of all U.S. households have been counted in the 2020 Census. For Hawaii, the total percentage counted is the same as the U.S. total—99.9 percent—but, the way in which these households were counted differ slightly, with 63.0 percent of households self-responding and 36.9 percent counted during the NRFU phase. The distinction here is important because lower self-response rates are correlated with a less accurate census count. So, how accurate is the Census given that nearly one-third of responses are derived from the NRFU phase?
Accuracy of the Census
Overall, the Census is very accurate. For the 2010 Census, the bureau reported a net over-count of 0.01 percent. In other words, the census counted an additional 36,000 individuals than the actual number of individuals in the United States.[1] However, given that these results are determined through survey methods, the difference is not statistically different from zero.
While this is good news for the census in general, the accuracy of the results is not the same for all groups counted. In the 2010 Census for example, renters were undercounted by 1.1 percent and homeowners were over-counted by 0.6 percent. By race, non-Hispanic whites were over-counted (0.8 percent) and black and Hispanic populations were undercounted (2.1 percent and 1.5 percent, respectively). Differences in accuracy also existed for groups by age and geography.
These differences can be explained by the inherent difficulty associated with counting certain groups. For example, a person with transient living accommodations is harder to count than an individual living in a single household year-round. Groups for which an accurate count is difficult to obtain are called “hard-to-count” populations. Studies on the topic of hard-to-count populations suggest that there are several groups who are likely to be undercounted in a census. These include:
Individuals in non-traditional or impermanent housing—renters, those with shared accommodations, homeless, households with non-city style addresses, mobile persons;
Individuals living in rural or geographically isolated areas;
Individuals without a high school diploma;
Individuals with mental or physical disabilities;
Young children;
Divorced males;
Unemployed individuals;
and LGBTQ populations
In Hawaii, the areas shown in Map 1 (below) were identified as hard-to-count areas. These areas were highlighted because they had a mail return rate less than 73 percent in the 2010 Census. Early identification of populations likely to be undercounted often helps focus efforts to ensure a more complete count.

Obtaining a complete and accurate count has been especially challenging for Census 2020. Early on, there was controversy around the inclusion of a “citizenship” question and the impact the question would have on response rates. Then the COVID-19 pandemic dramatically shifted the Census Bureau’s operations and timeline for conducting the census. With the recent ruling by the US Supreme Court, the Census will have a shortened period of time to complete field operations. This means that many of those hard-to-count individuals will be missed in the final enumeration.
To be sure, the Census reported that they have collected responses from 99.9 percent of all U.S. households (through self-response or NRFU). Still, the 0.1 percent of households that have not responded is roughly 140,000 households (550 households in Hawaii). In addition, there are those individuals in atypical living situations, many of whom do not reside in any single household.
In Hawaii, we may already be able to see the impact of the recent events mentioned above on census results. Map 2 (below) shows areas where Census 2020 self-response rates were less than 73 percent (a threshold used to compare with the hard-to-count areas in Map 1). The self-response rates across the islands were seemingly worse than one might expect in a “normal” census year.

Map 2. Areas with low self-response rates (lower than 73 percent)
Taken together, a lower self-response rate and shortened period of time to capture the “hardest-to-count” populations means that this census will have missed some of the more marginalized in our communities. It is difficult to determine who these individuals are or the magnitude by which they have been undercounted. Further it may not be possible to begin to understand for another 10 years.
Implications
As a demonstration of this issue, we look at the count of Native Hawaiians in the continental United States in 2000 and 2010.[2] In 2000, the Census reported 161,507 Native Hawaiians living on the continent. Ten years later in 2010, the Census reported 237,107 Native Hawaiians living on the continent. Looking at the 2000 numbers alone, there is no way to tell if the count is erroneous. In comparison to the 2010 numbers, one often assumes that the difference is due to the components of population change—births, deaths, and migration.
If we disaggregate the Census 2000 and 2010 counts of Native Hawaiians on the continent by age and sex, we can view the structure of the population to give us insight into the accuracy of these two censuses. To do this, we take the Census 2000 counts by age and sex and “survive” the population 10 years forward to 2010. The “survived” population can then be compared with the actual 2010 Census count to observe any differences. Figure 1 below shows the result. Notice the youngest age is 10 years old, as zero was the youngest age possible 10 years earlier in 2000. The horizontal bars represent the 2000 Census count, but with 10 years of age added to the population. The black line represents the 2010 Census count. When the black line and ends of the horizontal bars are close to or on top of each other, there is agreement between the two censuses. When the black line and the ends of the horizontal bars are far apart, there is disagreement between the two censuses. In general, there is agreement between the 2000 and 2010 Census counts for the population ages 50 and older.[3] For the population ages 10 to 28 there is a large discrepancy. This discrepancy is mostly explained by a significant undercount of the Native Hawaiian population ages 0 to 18 in the continental U.S. in 2000.[4] Specifically, the 2000 Census undercounted the Native Hawaiian population on the continent by roughly 24,000 individuals—a 29 percent undercount.[5]
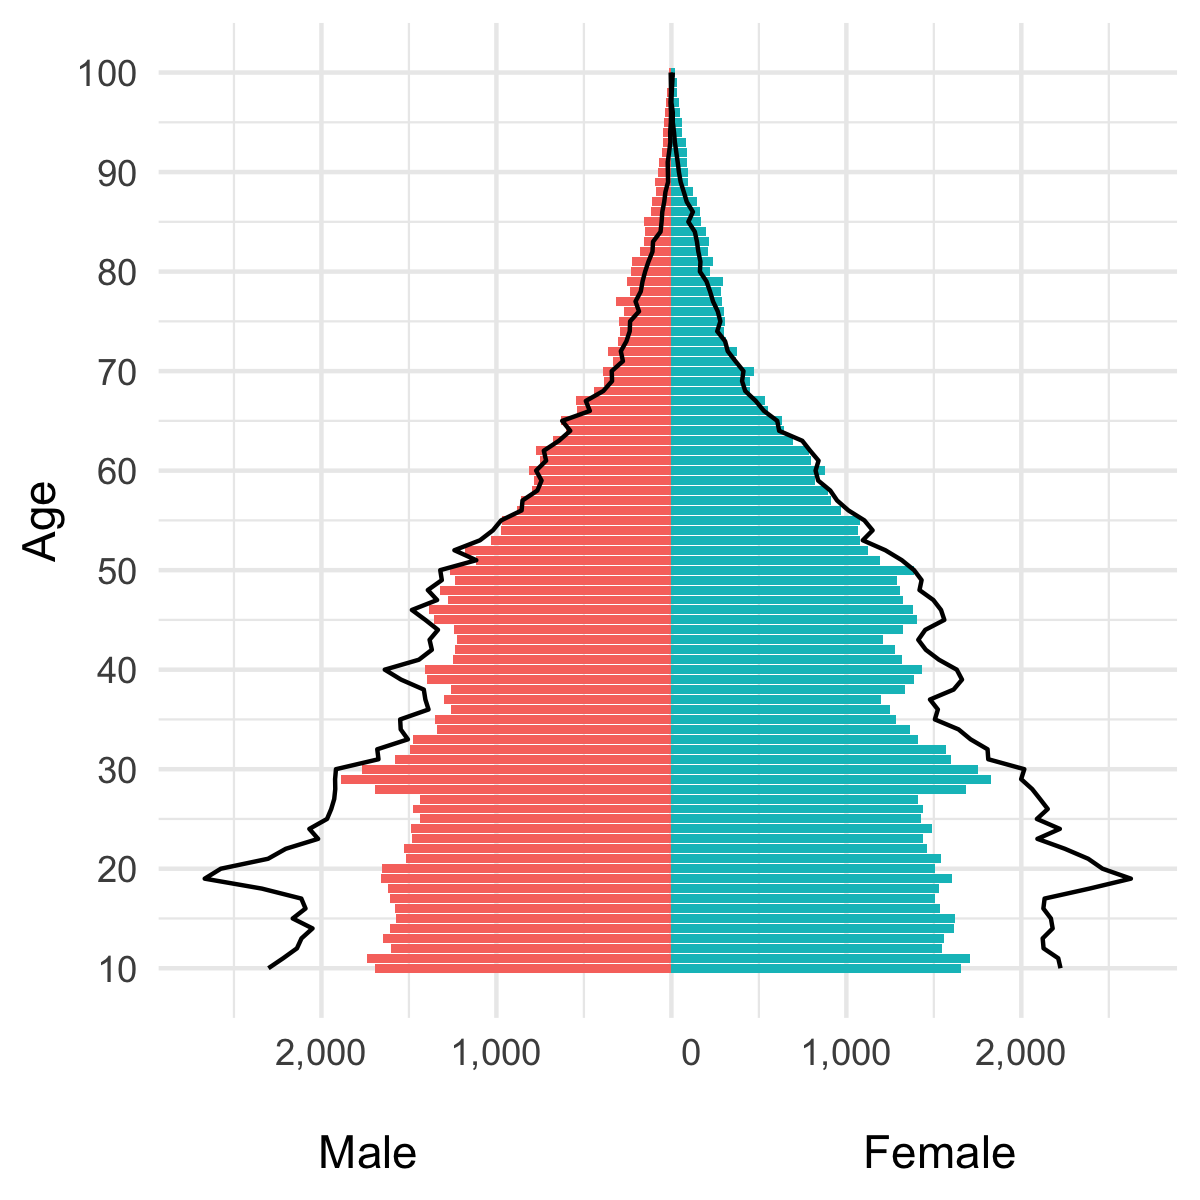
Figure 1. Structural comparison of the Native Hawaiian population in the continental United States, 2000 (“survived”) and 2010
What does it mean when such a large proportion of the population is missed in the Census, such as in the example above?
Consider the many different uses of Census data and one can easily see the far-reaching impact that undercounting a population may have. Census data are used for many different purposes. Foundational to our system of representative government in the United States, Census data are used to apportion congressional seats for federal legislation. Census data are also used to distribute over $675 billion of federal funds through 132 programs, such as the Medical Assistance Program, Supplemental Nutrition Assistance Program, and highway planning and construction. Census data are used for other survey and estimates programs like the American Community Survey and Population Estimates Program, which produces official intercensal estimates and postcensal projections of the population. Census data are used as denominators in calculating rates, such as when calculating crime rates. Census data are used for civil rights issues—for example, to identify jurisdictions that require language assistance in voting according to the Voting Rights Act. Further, Census data are used by numerous public and private sector organizations for the purposes of research and planning.
When a group of individuals in not represented in the Census, they are not represented in our system of government. The communities in which they live do not receive needed funding for important programs. The very existence of these individuals may not even be known. All of this results in the marginalization of individuals who are already living on the margins.
[1] While it is nearly impossible to know the exact number of individuals in the United States at any point in time, the Census Bureau uses various methods to estimate the accuracy of the census counts.
[2] The results presented in this example are taken from an earlier study conducted on the Native Hawaiian population in the United States.
[3] For the population ages 50 to 69, there is an aggregate difference of 1 between the 2000 and 2010 censuses. For the population ages 70 and older, there are more individuals in 2000 than in 2010. This difference is due to the simplified modeling approach shown in the example, which does not take into account survivorship probabilities that are common in population models. When taking into account the survivorship probabilities and applying them to the 2000 Census count, there is greater agreement between the 2000 and 2010 Census counts for the population ages 70 and older.
[4] It is possible that the difference between the 2000 and 2010 Census counts for this age group can be explained by migration of the population. However, our analysis revealed that the difference still exists even after taking migration into account.
[5] Census 2000 counts of the young Native Hawaiian population were much more accurate for those living in Hawaii than they were for those living on the continent.
Justin Hong is a consultant to the Hawaii Data Collaborative.