
Checking Up on Hawaii’s Economic Health: Existing Metrics Tell Us Only Pieces of the Story
by Kendrick Leong, Hawaii Data Collaborative
In addition to tracking public health, many local decision makers are also keen on tracking economic health. Conventional indicators of economic health include gross domestic product (GDP), the unemployment rate, and consumption-based indicators such as retail and food sales. Many economists look to GDP, or the total value of all finished goods and services created in the state, as an indicator of economic health. The logic goes that economic recovery will resemble a return to pre-pandemic production of finished goods (think pounds of poi or cans of soda – yes, we can the blue cola brand locally) and provision of services (as in the number of dogs groomed or attorneys’ billable time).
We should also keep an eye on the unemployment rate, which tracks COVID-related wage cuts and layoffs, as well as the efficacy of state and federal unemployment insurance programs. Recovery in the unemployment rate (that is, a downward trend in unemployment) may suggest that companies are hiring, but it is also important to know that the unemployment rate can appear to go down if workers give up on looking for new jobs.
Finally, consumption-based indicators such as retail and food sales tell us about household spending patterns – not only signaling whether households have the money for retail shopping or dining out, but also how cost-cutting, wage cuts, and layoffs have impacted our ability to purchase necessities. Recovery in retail and food sales may suggest a number of things: from consumers more willing to shop since our stores and restaurants reopened, to families better able to buy groceries, and even small spikes like the run on toilet paper and other necessities in the lead-up to Hurricane Douglas last month.
Although measures of GDP, unemployment, and retail and food sales all help assess the state of the local economy, there are a few caveats. One is data timeliness, or the schedule in which data is published and disseminated. GDP, reported quarterly, and retail and food sales, generally reported monthly, are often too slow to inform policy and planning decisions that need to be made and adjusted daily or weekly. However, Hawaii does do a good job in tracking unemployment claims weekly through the Hawaii Workforce Infonet, at least giving us a sense of the local job market. Another is data completeness, or how comprehensive a dataset is for answering the question at hand – in this case: how well is Hawaii’s economy recovering? Without one single identifiable metric for economic recovery, we need to look at other indicators beyond GDP, unemployment, and retail and food sales.
Getting Creative
Economists have had to get creative in looking at different indicators that may track economic recovery. Earlier this year, we began tracking mobility data, based on anonymized geolocation reports from location-enabled smartphones and other mobile devices obtained at the county level by Descartes Labs:
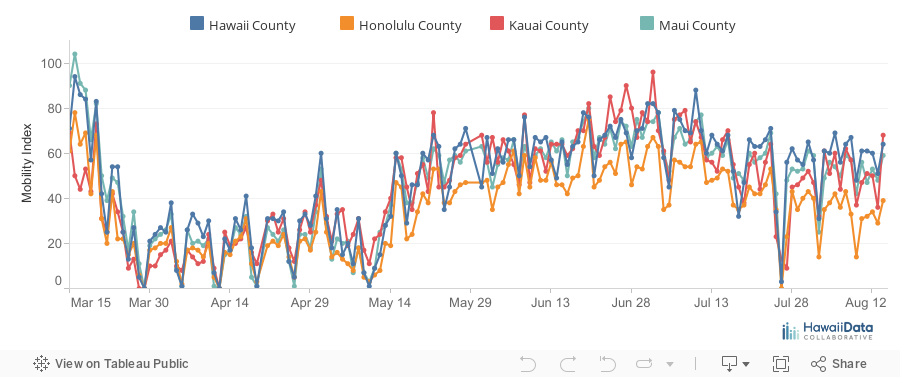
This data is statistically aggregated, removing the ability to characterize the behavior or identity of any single device. Google and Apple have published similar metrics based on anonymized, aggregated data sourced from their own mapping and navigation platforms.
Mobility data serves as a proxy for economic activity; in early March when Governor Ige implemented the stay-at-home order statewide, we naturally saw a large drop in mobility across Hawaii. Fewer (or no) commutes to work suggested both the rise of work-from-home policies as well as fewer jobs to commute to. This latter trend is especially evident when viewed in conjunction with the increase in unemployment claims starting in March.
In the present day, increased mobility across the state suggests a return to on-site work for some of Hawaii’s white-collar workers, more trips to reopened malls and restaurants (and by proxy, measured recovery in retail and food sales), and more (social distancing-compliant) outings to parks and beaches. As an auxiliary indicator of economic recovery, mobility metrics help to quantify the effects of the stay-at-home order earlier this year and may also help to quantify the state’s reopening process into the fall.
The difficulty in measuring economic recovery is that the indicators we choose may not always measure the trends we expect them to. Mobility metrics, when analyzed alone, only tell us where people are going; we need to infer what these patterns mean. The sharp drop in mobility from March of this year told us that people were not commuting to work or going out to shop in compliance with the stay-at-home order. It did not tell us how many people were working from home, or shopping online, or ordering delivery. Tracking the economic recovery therefore invites us to look at even more supplementary indicators – especially as mobility rises again.
A failure to return to pre-pandemic mobility levels is not a failure in economic recovery; it could equally as likely reflect changing lifestyle patterns. This holds true for other creative indicators of economic recovery: restaurant table reservations could go up as the state returns to dining out, or it could stay flat because local foodies realized they could enjoy our rich and varied cuisines from the comfort of their own homes through delivery services; local retail sales could show signs of recovery as people return to malls, or it could stay flat as consumers double down on the convenience and no-contact nature of e-commerce and online shopping.
Economic Recovery Indicators Define Economic Recovery
We will continue to have to infer trends from economic recovery indicators as Hawaii reopens to travel and tourism. The elephant in the room that has yet to be mentioned are the important indicators for Hawaii’s tourism-based economy: visitor arrivals and expenditures. Down the road, when it is safe to begin opening our shores and hotels again to tourists, these two metrics will be front-and-center in the discussions about how our economy is recovering.
It would be easy to point to increasing visitor arrivals and expenditures as tell-tale signs of an economic recovery: tourists and tourism dollars increase our GDP, create (or restore) service jobs that bring down our unemployment rate, warrant commutes to said jobs, directly contribute to restaurant table reservations, and increase local retail sales. In short, every metric I mentioned here is impacted in some way by visitor arrivals and expenditures. But just as how there is no one metric for economic recovery, so too should we think about visitor arrivals and expenditures in the context of other indicators: for example, visitors may come back, but they may spend less daily, or in total, than pre-pandemic levels.
Given economic recovery’s reluctance to be quantified, and the need for varied, often creative indicators, this moment provides us an excellent opportunity to rethink the way we measure, define, and track economic recovery in the first place. Our understanding of what economic recovery is is directly defined by the metrics and indicators we choose to track. A recovery measured by GDP may not be an economic recovery as a whole, but instead merely a recovery of pre-pandemic levels of GDP. The same can be said of visitor arrivals, expenditures, mobility, or unemployment. As we track these indicators in the coming months, it is important to remember that they must be understood as the metrics we have consciously chosen to define economic recovery, subject to our own understandings of what economic recovery is and what it could be.