
Understanding COVID-19 Transmission in Hawaii
What effect could each of us have in slowing the transmission of the coronavirus (COVID-19) in Hawaii? What might happen to the number of infections if we take no action, or pursue more aggressive social distancing measures?
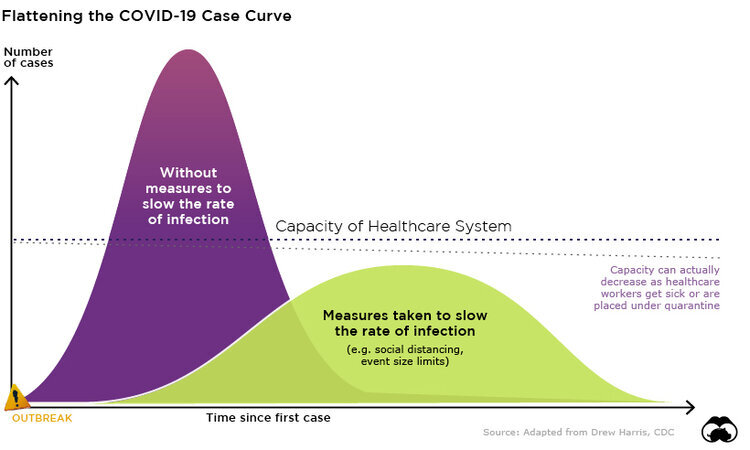
Much of the reporting on COVID-19 transmission occurs on an international or national scale, which can dampen the local sense of urgency regarding spread of the disease. But our community members’ actions will profoundly shape COVID-19’s impact on Hawaii. As the number of confirmed cases in Hawaii continues to climb, answers to questions like those above underscore the importance of mitigation strategies like social distancing.
Number Infected in Hawaii Over Time
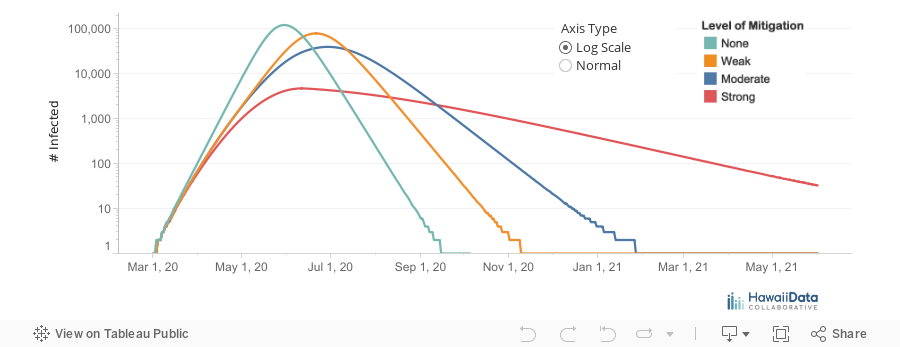
To help illustrate the role of social distancing measures in preventing the spread of COVID-19, we have been working to adapt current transmission models for Hawaii. In the graph above, you can see how existing mitigation efforts are projected to influence the spread of the virus, as compared to no action and more aggressive measures.
Weak Mitigation: Personal protective measures (e.g., staying home when sick, hand washing, clean frequently touched surfaces), resulting in an assumed 20 percent reduction in transmission
Moderate Mitigation: Avoiding gatherings or other situations of potential exposures, including travel, resulting in an assumed 40 percent reduction in transmission
Strong Mitigation: Limiting community movement (e.g., school and/or work closures) according to guidance from local officials, resulting in an assumed 60 percent reduction in transmission
A couple of things to note about this chart: 1) The number of infections are charted on a logarithmic (log) scale, which means the tick marks for number infectious are exponential, rather than linear (i.e. the number infectious is increasing more rapidly in the upper parts of the graph; 2) The model only allows for interventions to change monthly, we adapted the current levels of intervention as best as possible, but they are not exactly aligned.
Number of Critical Cases in Hawaii Over Time
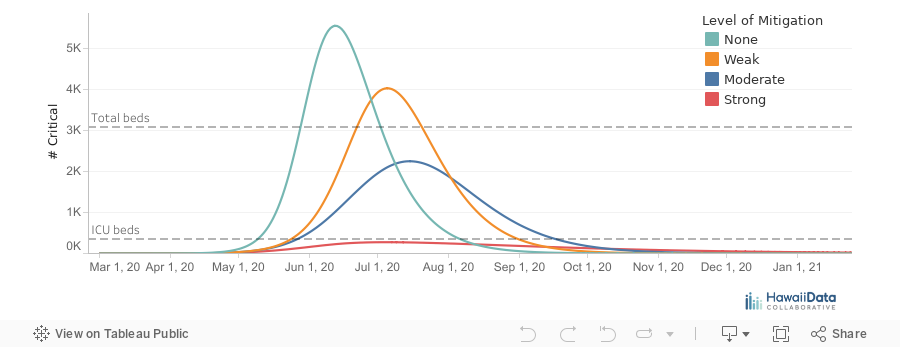
Additionally, in this second graph above, we have modeled the number likely to be critically ill (those who will need intensive care) over time. Note this is now on a linear scale because the numbers are much less than overall infectious. In this graph, we have added lines that represent the current number of regular patient beds and intensive care unit (ICU) beds in Hawaii’s hospitals. The model suggests that only the strongest mitigation measures will prevent exceeding the number of intensive care units. The model also does not account for existing usage of beds for non-COVID-19 cases (as of 2018, Hawaii’s average hospital bed occupancy was 65.5 percent).
Of course, this is a simplified model of reality. Not only do we not have a perfect understanding of the disease and its effects, but there are broader considerations around effectively implementing different levels of mitigation scenarios.
These forecasts were generated using an accessible modeling tool created by researchers at the University of Basel in Switzerland. We have modified the modeling tool to focus specifically on Hawaii’s population, below. Using the tool, you can explore how different mitigation strategies, and the times at which they are employed, can influence the transmission trajectory of the virus. Other parameters such as latency, importation rate, etc., can be adjusted as well, allowing you to explore more deeply how changes in these parameters might affect the transmission curve.
It is important to note that this model, and our implementation of the model for Hawaii, are built on numerous assumptions and uncertainties, particularly given the evolving nature of the COVID-19 pandemic. While we will continue to work to ensure this model reflects new information about the virus, please use caution when drawing conclusions from these projections.